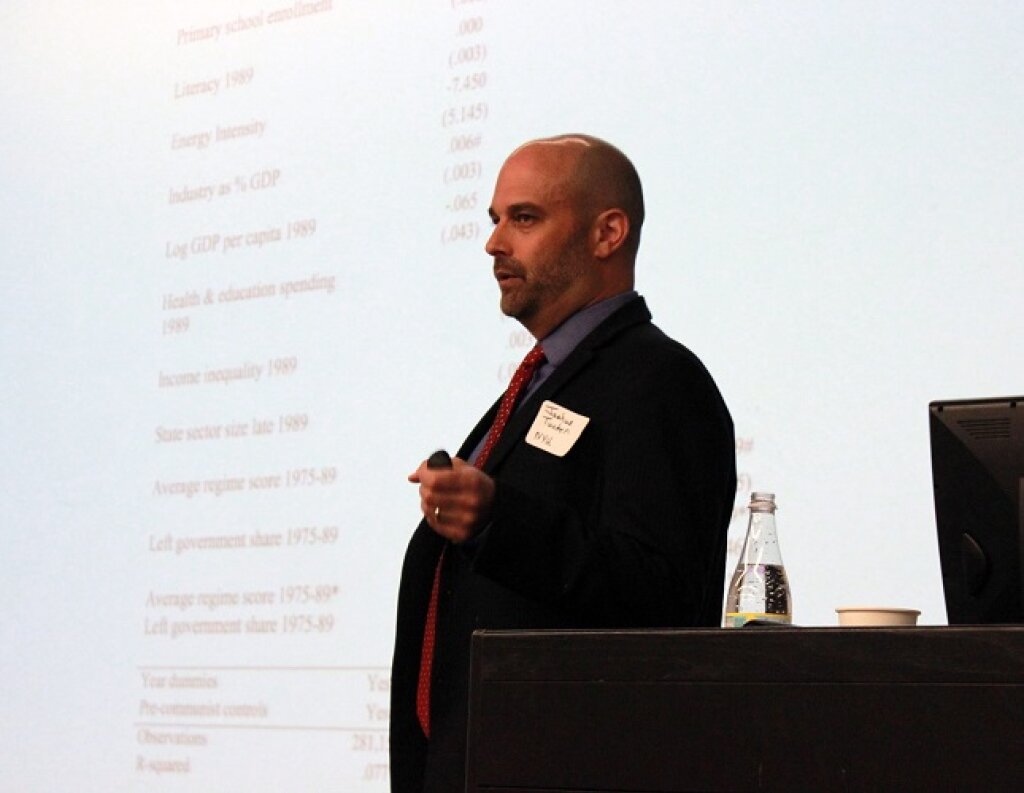
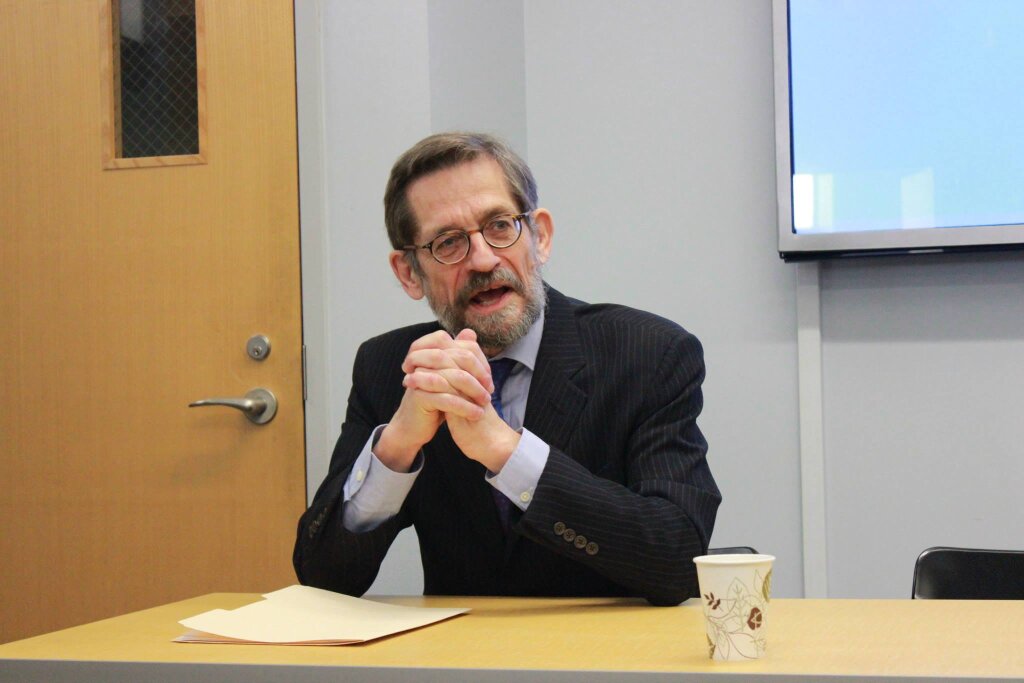
On Wednesday October 3, the Jordan Center hosted a talk by Associate Chair for Undergraduate Studies in Fordham University’s Political Science Department Olena Nikolayenko, titled “Geography of Anti-Corruption Protests in Russia”. Professor Nikolayenko is also an Associate at the Harvard University Davis Center for Russian and Eurasian Studies. The event was was introduced by Jordan Center Director and Professor of Politics Joshua Tucker, and was part of the Occasional Series.
The talk concerned Nikolayenko’s ongoing research about the geographic spread of the 2017 anti-corruption protests in Russia. In her research, Nikolayenko attempts to answer the question of why the numbers of protesters were larger in certain cities than in others. Over the course of the talk Nikolayenko cited existing literature on the subject matter, and discussed her own methodological approach.
The year 2017 was marked by Russia’s largest protests since 2012. “Politics have been getting more and more interesting,” Nikolayenko said, noting the higher frequency of public outbursts in recent years. Opposition leader Alexei Navalny’s widely known investigative video that was published on March 2017 exposed Prime Minister Dmitry Medvedev’s excessive spending habits, leading to widespread public frustrations across the whole country. “The authorities were struck by the size of the protests,” Nikolayenko said. Citing Russia’s low ranking in the global corruption index, Nikolayenko noted that a corruption investigation as the catalyst for the protests shouldn’t come as a surprise. But because corruption is an evident and ongoing problem in Russia, the timing of the protests did come as a surprise for Nikolayenko. The fact that the protests spread well beyond Russia’s two major cities, Moscow and St. Petersburg, was also a very striking feature.
Nikolayenko then proceeded by displaying a protest map produced by the Riga-based independent Russian media outlet Meduza. The map displayed protests in nearly 100 cities, with the largest protests in cities with populations exceeding half a million. The numbers however, are often deflated by the authorities, Nikolayenko said, pointing to a Moscow police report that indicated a 300 person turnout as opposed to Alexei Navalny’s spokesman’s claim of number ranging in the thousands. The determinants of turnout at the protest ranged from grievances against electoral fraud to degrees of police repression to economic development to the connectivity of social networks both online and offline.
Protest behavior has shifted over the past three decades: whereas in the 1990s protests were often propelled by socioeconomic grievances and took place in smaller towns impacted heavily by economic decline, the protests of 2011 were much more politically charged and reacting to vote rigging. After the 2011 protests, “civic activists retreated to local and socioeconomic issues”, and Moscow and St. Petersburg once again lost their status as epicenters of protest activity. Research shows that certain regions are more prone to protests, while other regions, particularly in central Russia, remain consistently inactive. In her work, Professor Nikolayenko examines how the interplay between intensity of socioeconomic grievances, social connectedness, and police repressions influence the size of corruption protests by city.
In the latter half of her talk, Professor Nikolayenko laid out her her methodology. She chose the city as her unit of analysis, picking out the 100 largest Russian cities, all of which contain, other than a few cities of administrative importance in remote republics like Ingushetia, a population of at least 100,000. Data taken from Meduza and cross-validated with local news sources showed that Russia contains 15 cities with a population of over 1 million and 22 cities with populations between half a million and 1 million. Nikolayenko’s dependent variable is the proportion of how many protests emerged on the streets divided by the population of the cities. In 33 of the sampled cities protests were not held at all, while the most protests according to this variable occurred in the Volga Region and Siberia. In Moscow, 1/5 of 1 percent of the city’s population took to the street, a number that when likened to events such as the Orange Revolution seems minor and insignificant.
Professor Nikolayenko’s independent variables included regional measures of petty corruption – with southern cities showing the highest levels, an index of budget transparency, local student populations, daily internet usage, and interpersonal trust – the data for which was compiled by real estate companies who examined the quality of life in particular cities by asking people what they thought of their neighbors. More variables included average monthly wages, an SGM index of sustainable development, natural resource production and the level of state repression. Regarding the final marker, Nikolayenko mentioned how activists are required to gain approval from city authorities in order to stage a demonstration – a tedious and often futile process. Unsanctioned protests are considered illegal, and can result in a 20,000 ruble fine.
The results of Nikolayenko’s regression analysis showed that cities that had a prior record of protests, achieved higher levels of economic development, contained larger ethnic Russian and student populations, and had less administrative intervention showed higher protest participation. Cities where there were high levels of friendly neighborhood relations on the other hand – many of which were in the North Caucasus – had lower levels of protest.


